|
Carlin Trend - Mineralisation |
|
|
Nevada, USA |
| Main commodities:
Au
|
|
 |
|
|
 |
Super Porphyry Cu and Au

|
IOCG Deposits - 70 papers
|
All available as eBOOKS
Remaining HARD COPIES on
sale. No hard copy book more than AUD $44.00 (incl. GST) |
|
|
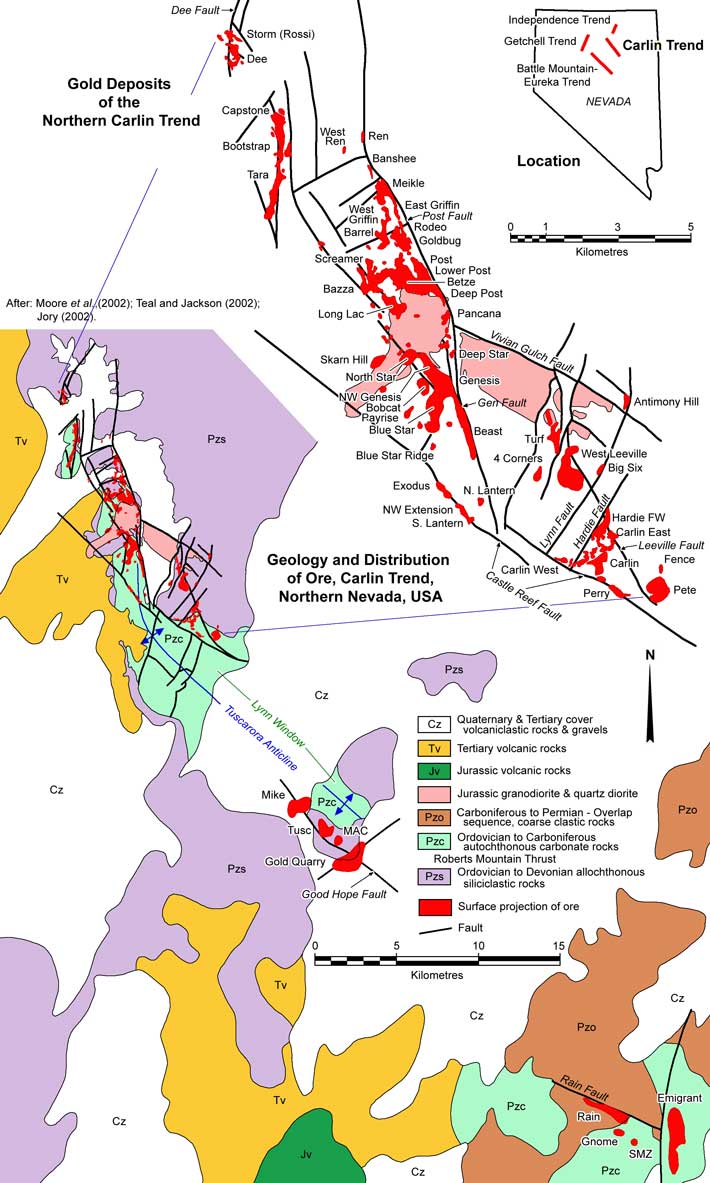
The Carlin Trend encompasses a group of around 30 separate centres of gold mineralisation (mainly sediment hosted) and extends in a general north-westerly direction (approximately 325°) over a presently known distance of 80 km in northeastern Nevada, USA. This trend, which is generally 'a few' kilometres, up to 8 km wide, extends from the Rain deposit in the south-east, to Ivanhoe in the north-west (Christensen, 1993). The bulk of the production and reserves that are known, are in two clusters of mines. These are found in two broad zones of outcrop of the host Palaeozoic sequences, separated by thick younger 'basin and range' cover.
Between 1965 and 1993 some 477 t of Au have been taken from mines within the Carlin Trend. Resources totalling in excess of 2500 t of Au (including the 477 t mined) had been identified in the 30 mineralised centres by 2000. Production in 1993 by three mining companies, from 6 mines and processed through 12 extraction facilities, was expected to total 93 t of Au (Christensen, 1993). By 2002, the total amount of gold mined from the Carlin Trend exceeded 1600 t Au and by 2008 had reached 2200 t.
For details on the mineral deposits and mineralisation on the Carlin Trend, see the separate Carlin Trend - Geology record, as well as separate records for most of the individual deposits listed.
All major mining to date has been from open pits, although several higher grade, deeper orebodies are being prepared for underground operations (Christensen, 1993).
The main deposits, both past and present, on the Carlin Trend, as known in 2014 were, from north to south:
Ivanhoe/Hollister/Cornucopia - epithermal mineralisation
16.8 Mt @ 1.2 g/t Au = 20 t Au (Geological resource, Oxide Ore, 1989, Coope, 1991)
75 Mt @ 1.16 g/t Au = 87 t Au (Geological resource, Sulphide Ore, '89, Coope, 1991)
16.7 Mt @ 1.2 g/t Au (Resource, Bartlett, et al., 1990)
Storm
2.8 Mt @ 12.2 g/t Au = 34.2 t Au (Production+reserves+resources, 2002, Theodore, et al., 2003)
Dee
3.9 Mt @ 1.65 g/t Au = 6.4 t Au (Proven+probable reserve, 31 Dec. 1992, Christensen, 1993)
2.4 Mt @ 3.94 g/t Au (Original high grade reserve, 1983, Ellis, 1987)
1.8 Mt @ 0.86 g/t Au (Original low grade reserve, 1983, Ellis, 1987)
14.0 Mt @ 2.1 g/t Au = 29.27 t Au (Production+reserves+resources, 2002, Theodore, et al., 2003)
~10.3 Mt @ 3 g/t Au = 31 t Au (Pre-mining resource, Jory, 2002)
Arturo South - adjacent to, and including remnants from Dee
42.7 Mt @ 1.71 g/t Au = 73 t Au (Proved+probable ore reserves, 2010, USGS, after Barrick, 2010)
32.5 Mt @ 1.34 g/t Au = 43 t Au (Meas.+indic.+infer. resources, 2010, USGS, after Barrick, 2010)
Bootstrap & Capstone
~8.8 Mt @ 3 g/t Au = 26.5 t Au (Bootstrap, Pre-mining resource, Jory, 2002)
~3.1 Mt @ 3 g/t Au = 9.3 t Au (Capstone, Pre-mining resource, Jory, 2002)
~10 Mt @ 1.8 g/t Au = 18.5 t Au (Tara, pre-mining resource, Jory, 2002)
25.5 Mt @ 1.19g/t Au (Total geological reserve, 27/12/89, McFarlane, 1991)
21 Mt @ 1.27 g/t Au = 26 t Au (Proven+Probable Reserve, 31 Dec. 1992, Christensen, 1993)
6.8 t Au (Prod. 1918 to 1984, Baker, 1990)
20.6 Mt @ 1.77 g/t Au = 36.45 t Au (Production+reserves+resources, 2002, includes Tara also,
Theodore, et al., 2003)
Ren
0.41 Mt @ 1.7 g/t = 0.68 t Au Au (Production+Reserves+Resources, 2002, Theodore, et al., 2003)
Meikle/Purple Vein, Rodeo/Goldbug and Griffin underground
6.5 Mt @ 21 g/t Au (Proven+probable Reserve, Dec '92, Christensen, '93)
7.6 Mt @ 23.5 g/t Au = 177 t Au (Proven+probable Reserve, Dec '94, Volk, et al., 1995)
9.1 Mt @ 24.4 g/t Au = 222.11 t Au (Production+reserves+resources, 2002, Theodore, et al., 2003)
7.54 Mt @ 11.4 g/t Au (Proved+probable reserves, 2007; Mining.com. 2008)
~10 Mt @ 21 g/t Au = 220 t Au (Meikle, pre-mining resource, Jory, 2002)
~3.8 Mt @ 12 g/t Au = 46 t Au (Rodeo, pre-mining resource, Jory, 2002)
~1.3 Mt @ 12 g/t Au = 15.5 t Au (Griffin, pre-mining resource, Jory, 2002)
~3.5 Mt @ 10.7 g/t Au = 37 t Au (Upper Goldbug, pre-mining resource, Jory, 2002)
~4 Mt @ 7.5 g/t Au = 31 t Au (Lower Goldbug, pre-mining resource, Jory, 2002)
10.6 @ 7.6 g/t Au (Goldstrike underground proved+probable reserves, 2013; Barrick Gold, 2014)
6.1 @ 9.2 g/t Au (Goldstrike underground measured+indicated resources, 2013; Barrick Gold, 2014)
1.3 @ 9.5 g/t Au (Goldstrike underground inferred resources, 2013; Barrick Gold, 2014)
Barrel
~1 Mt @ 6 g/t Au = 6.2 t Au (Pre-mining resource, Jory, 2002)
Screamer
~28 Mt @ 5.5 g/t Au = 155 t Au (Pre-mining resource, Jory, 2002)
Bazza
~1.6 Mt @ 1.5 g/t Au = 2.5 t Au (Pre-mining resource, Jory, 2002)
Long Lac
~1.3 Mt @ 1.5 g/t Au = 2 t Au (Pre-mining resource, Jory, 2002)
Post and Deep Post (Newmont)
30 Mt @ 5.55 g/t Au = 165 t Au (Proven+probable Res, 31 Dec. 1992, Christensen, 1993)
97 Mt @ 1.90 g/t Au = 189 t Au (Total Geol Reserve, 27/12/89, McFarlane, 1991)
177 Mt @ 2.2 g/t Au = 387 t Au (Total Geological Reserve, 1989, Coope, 1991)
~78 Mt @ 1.2 g/t Au = 93.5 t Au (Upper Post, Pre-mining resource, Jory, 2002)
~19.5 Mt @ 4 g/t Au = 77.5 t Au (Lower Post, Pre-mining resource, Jory, 2002)
~6 Mt @ 21 g/t Au = 125 t Au (Deep Post, Pre-mining resource, Jory, 2002)
Goldstrike (Betze - Barrick)
~208 Mt @ 6 g/t Au = 1250 t Au (Pre-mining resource, Jory, 2002)
98.3 Mt @ 6.96 g/t Au = 685 t Au (Proven+probable Res, Dec '94, Volk, et al., 1995)
102 Mt @ 6.15 g/t Au (Proven+probable reserve, 1992, Christensen, 1993)
73 Mt @ 1 g/t Au (Geological Resource, oxide Ore, 1989, Coope, 1991)
85 Mt @ 5.8 g/t Au (Geological resource, sulphide Ore, 1989, Coope, 1991)
96.4 Mt @ 4 g/t Au (Open pit proved+probable reserves, 2007; Mining.com. 2008)
85.6 Mt @ 2.9 g/t Au (Open pit proved+probable reserves, 2013; Barrick Gold, 2014)
5.9 Mt @ 2.1 g/t Au (Open pit measured+indicated resources, 2013; Barrick Gold, 2014)
1.1 Mt @ 2.2 g/t Au (Open pit inferred resources, 2013; Barrick Gold, 2014)
Pancana
~0.4 Mt @ 1.5 g/t Au = 0.6 t Au (Pre-mining resource, Jory, 2002)
Teamster
1 Mt @ 31 g/t Au = 31 t Au (Reserve, 1993, Andrew, 1993)
Deep Star
~1.75 Mt @ 30 g/t Au = 53 t Au (Pre-mining resource, Jory, 2002)
0.77 Mt @ 32 g/t Au = 24 t Au (Proven+probable reserve, 31 Dec. 1992, Christensen, 1993)
North Star
5.2 Mt @ 1.2 g/t Au = 6.2 t Au (Proven+probable reserve, 31 Dec. 1992, Christensen, 1993)
7 Mt @ 1.64 g/t Au (Total geological reserve, 27 Dec. 1989, McFarlane, 1991)
~3 Mt @ 2.4 g/t Au = 7 t Au (Pre-mining resource, Jory, 2002)
Bobcat
~7.5 Mt @ 0.9 g/t Au = 6.8 t Au (Pre-mining resource, Jory, 2002)
18 Mt @ 0.89 g/t Au = 16 t Au (Total geological reserve, 27 Dec. 1989, McFarlane, 1991)
Genesis/Blue Star
68 Mt @ 1.1 g/t Au = 75 t Au (Proven+probable reserve, 31 Dec. 1992, Christensen, 1993)
217 Mt @ 1.3 g/t Au = 282 t Au (Proven+probable reserve, 2011, after Newmont, 2012, USGS, 2014)
84.1 Mt @ 0.93 g/t Au = 78 t Au (Measured+indicated+inferred resource, 2011, after Newmont, 2012, USGS, 2014)
34 Mt @ 1.42 g/t Au (Genesis, total geological reserve, 27 Dec. 1989, McFarlane, 1991)
22 Mt @ 0.95 g/t Au (Blue Star, total geological reserve, 27 Dec. 1989, McFarlane, 1991)
~31 Mt @ 3 g/t Au = 93 t Au (Genesis, pre-mining resource, Jory, 2002)
~3.6 Mt @ 2 g/t Au = 7.8 t Au (West Genesis, pre-mining resource, Jory, 2002)
~9.3 Mt @ 0.6 g/t Au = 5.6 t Au (Blue Star Ridge, pre-mining resource, Jory, 2002)
~10.3 Mt @ 1.2 g/t Au = 12.5 t Au (Blue Star, pre-mining resource, Jory, 2002)
Blue Star has been mined since 1974, Genesis since 1986
Beast
~2.5 Mt @ 0.6 g/t Au = 1.5 t Au (Pre-mining resource, Jory, 2002)
SOLD
~1.5 Mt @ 0.6 g/t Au = 0.9 t Au (Pre-mining resource, Jory, 2002)
Payraise
~1.5 Mt @ 0.6 g/t Au = 0.9 t Au (Pre-mining resource, Jory, 2002)
Lantern and Exodus
15.7 Mt @ 0.89 g/t Au (Total geological reserve, 27 Dec. 1989, McFarlane, 1991)
1.6 Mt @ 14 g/t Au = 22 t Au (Lantern, reserve1993, Andrew, 1993)
~3 Mt @ 1 g/t Au = 3 t Au (North Lantern, pre-mining resource, Jory, 2002)
~5 Mt @ 1.2 g/t Au = 6 t Au (South Lantern, pre-mining resource, Jory, 2002)
~4 Mt @ 3.1 g/t Au = 12.4 t Au (Exodus, pre-mining resource, Jory, 2002)
Antimony Hill
~0.4 Mt @ 1.5 g/t Au = 0.62 t Au (Pre-mining resource, Jory, 2002)
Turf
~2.75 Mt @ 11 g/t Au = 30 t Au (Pre-mining resource, Jory, 2002)
14.9 Mt @ 6.86 g/t Au = 102 t Au (Underground resources, Mohling, 2002)
Four Corners
~1.25 Mt @ 7.6 g/t Au = 9.3 t Au (Pre-mining resource, Jory, 2002)
West Leeville
~8 Mt @ 11.3 g/t Au = 93 t Au (West Leeville, pre-mining resource, Jory, 2002)
6.08 Mt @ 7.95 g/t Au (Leeville, proven+probable reserve, 31 Dec. 2012, Infomine, 2014)
6.08 Mt @ 7.95 g/t Au (Leeville, proven+probable reserve, 31 Dec. 2012, Infomine, 2014)
9.67 Mt @ 9 g/t Au = 87 t Au (Leeville, proven+probable reserve, 2011, after Newmont, 2012, USGS, 2014)
8.47 Mt @ 5.3 g/t Au = 45 t Au (Leeville, measured+indicated+inferred resource, 2011, after Newmont, 2012, USGS, 2014)
Big Six
~0.4 Mt Mt @ 1.5 g/t Au = 0.6 t Au (Pre-mining resource, Jory, 2002)
Carlin
12.5 Mt @ 9.26 g/t Au = 115 t Au (Main production period, 1965 to 1986, Myers, 1993)
8.25 Mt @ 0.95 g/t Au (Proven+probable reserve at restart, Aug. 1992, Myers, 1993)
21 Mt @ 0.92 g/t Au (Total geological reserve, 27 Dec. 1989, McFarlane, 1991)
~12.7 Mt Mt @ 12 g/t Au = 155 t Au (Pre-mining resource, Jory, 2002)
~4.2 Mt Mt @ 1.8 g/t Au = 7.7 t Au (Carlin West, pre-mining resource, Jory, 2002)
84 Mt @ 1.3 g/t Au = 109 tonnes of Au (Carlin open pits - Proved + probable reserves; USGS after Newmont, 2012)
7.3 Mt @ 9.67 g/t Au = 70 tonnes of Au (Carlin underground - Proved + probable reserves; USGS after Newmont, 2012)
33 Mt @ 0.93 g/t Au = 31 tonnes of Au (Carlin open pits - measured+indicated+inferred resources; USGS after Newmont, 2012)
3 Mt @ 8.47 g/t Au = 25 tonnes of Au (Carlin underground - measured+indicated+inferred resources; USGS after Newmont, 2012)
All Newmont Carlin Trend deposits - includes Carlin group, Gold Quarry & others - remaining reserves and resources
246.3 Mt @ 1.23 g/t Au = 303 tonnes of Au (Carlin open pits - proved+probable reserve, Newmont, 2014);
21.6 Mt @ 8.63 g/t Au = 187 tonnes of Au (Carlin underground - proved+probable reserve, Newmont, 2014).
Perry
~2.5 Mt @ 0.6 g/t Au = 1.5 t Au (Pre-mining resource, Jory, 2002)
Fence
~1 Mt @ 6.2 g/t Au = 6.2 t Au (Pre-mining resource, Jory, 2002)
Pete
5.8 Mt @ 0.9 g/t Au = 5.3 t Au (Proven+probable reserve, 31 Dec. 1992, Christensen, 1993)
16 Mt @ 0.92 g/t Au (Total geological reserve, 27 Dec. 1989, McFarlane, 1991)
~17 Mt @ 1.8 g/t Au = 30 t Au (Pre-mining resource, Jory, 2002)
Mike
370 Mt @ 0.72 g/t Au = 266 t Au (Mineral inventory at 0.2 g/t Au cut-off, 2002, Norby, Michael & Orobona, 2002), including:
137 Mt @ 0.34 wt.% Cu -and- 17 Mt @ 2.13 wt.% Zn
Tusc
12 Mt @ 2.1 g/t Au = 25.7 t Au (Proven+probable reserve, 31 Dec. 1992, Christensen, 1993)
16 Mt @ 1.86 g/t Au (Total geological reserve, 27 Dec. 1989, McFarlane, 1991)
MAC
5.2 Mt @ 0.55 g/t Au = 2.8 t Au (Proven+probable reserve, 31 Dec. 1992, Christensen, 1993)
Gold Quarry
348 Mt @ 1.15 g/t Au = 400 t Au (Gold Quarry - proven+probable reserve+production, 1993, Rota, 1993)
163 Mt @ 1.39 g/t Au (Gold Quarry - Proven+probable reserve, 31 Dec. 1992, Christensen, 1993)
543 Mt @ 1.17 g/t Au = 635 t Au (Gold Quarry - Total geological reserve, 27 Dec. 1989, McFarlane, 1991)
130 Mt @ 1.68 g/t Au = 218 t Au (Gold Quarry - Initial pre-Mining reserve after 550 holes, Ryneer, 1991)
4.35 Mt @ 3.2 g/t Au (Maggie Creek Mine - reserve 1980, Christensen, 1993)
0.308 Mt @ 4.1 g/t Au (Gold Quarry, Initial reserve, 1970, Rota, 1993)
Total contained gold in production+reserve/resource in 2002 = 746 t Au (Harlan et al., 2002)
136 Mt @ 1.5 g/t Au = 204 t Au (Gold Quarry, open pit proved+probable reserve, 2005, USGS, 2014)
0.94 Mt @ 13.1 g/t Au = 12.3 t Au (Gold Quarry, underground proved+probable reserve, 2005, USGS, 2014)
Rain
14 Mt @ 2.26 g/t Au = 31.6 t Au (Pre-mining reserve, 1986, Thoreson, 1990)
12.8 Mt @ 2.6 g/t Au (Initial reserve, 1985, Ryneer, 1991)
4.1 Mt @ 5.6 g/t Au, plus
2.9 Mt @ 1.17 g/t Au (Initial reserve, 1985, Thoreson, 1987)
4 Mt @ 1.7 g/t Au (Proven+probable reserve, 31 Dec. 1992, Christensen, 1993)
22.9 t @ 1.64 g/t Au (Total geological reserve, 27 Dec. 1989, McFarlane, 1991)
36.4 Mt @ 1.8 g/t Au (Open pit production from Rain & SMZ to 2000, Williams et al., 2000)
4.9 Mt @ 7.7 g/t Au (Underground production+reserve at Rain & Tess, 2000, Williams et al., 2000)
4.6 Mt @ 11.6 g/t Au = 53 t Au (Underground proven+probable reserve, 2000, Longo et al., 2002)
Total contained gold = 103 tonnes of contained gold, open pit+underground (from Williams, et al., 2000)
SMZ
1.6 Mt @ 0.58 g/t Au = 0.93 t Au (Total geological reserve, 1989, Thoreson, 1990)
Gnome
2.5 Mt @ 1.65 g/t Au = 4 t Au (Total geological reserve, 1989, Coope, 1991)
Emigrant
4.5 Mt @ 1.2 g/t Au = 5.2 t Au (Proven+probable reserve, 31 Dec. 1992, Christensen, 1993)
11.7 Mt @ 0.76 g/t Au (Total geological reserve, 27 Dec. 1989, McFarlane, 1991)
27.5 Mt @ 0.72 g/t Au (Total geological reserve, 1989, Coope, 1991)
History
Prospecting and mining has been conducted along the Carlin Trend at various times during the last 120 years. The first recorded prospecting was in the 1870's. These included small placer workings along Maggie Creek whose headwaters drain the eastern sections of the Gold Quarry and the Carlin deposits. Shallow diggings are also recorded from the same period at Schroeder Mountain (Ryneer, 1991). These diggings were about 2 km to the north of the present Gold Quarry open pit (Ekburg, et al., 1990). In the early 1900's further alluvial gold was encountered in a tributary of Maggie Creek, Lynn Creek, draining east from the Carlin area, and in the Sheep Creek catchment on its western side. Rare nuggets of up to 15 g were found. These two creeks yielded 67.5 and 112.5 kg of Au respectively to 1936. The Big Six auriferous quartz lode deposit was located at the watershed between the Lynn and Sheep Creek catchments in 1907, and has been mined sporadically since then, with the development of 1500 m of underground workings. Native Au occurs within quartz hosted by the allochthonous silici-clastics of the upper plate Vinini Formation above the Roberts Mountains Thrust, within 2 km of the Carlin pit (Ryneer, 1991).
The Nevada Star mine was worked between 1906 and 1909. It is several hundred metres to the north-east of the MAC deposit and is located along the strike of the Good Hope Fault between the Gold Quarry mine and the Tusc deposit. The workings were centred on a north-west striking, 2 m wide vein containing galena, silver, copper carbonates and abundant barite. The mineralised vein dips steeply to the north-east through highly silicified limestone of the Roberts Mountains Formation (Ekburg, et al., 1990).
In 1907 the small Copper King deposit was also discovered, 2.4 km to the north-west of the current Gold Quarry pit, and immediately adjacent to the Tusc deposit. Cu ore of between 2 and 7%, with minor Au, was mined from shear zones. Mineralisation occurred as chrysocolla, azurite, malachite and cuprite in small veins cutting silicified siltstone, shale, chert and limestone of the Vinini Formation. Mineral zones were located along shears that strike at 60°. In 1918 a stibnite vein was discovered on the site of the present Bootstrap mine. In 1925 turquoise float was found over the area now occupied by the Blue Star mine (Ryneer, 1991; Ekburg, et al., 1990).
Barite was recognised in the Maggie Creek area in the early 1930's, leading to the development of the Maggie Creek Barite Mine. During 1935 Au was discovered near the barite mine, with 54 t @ 13 g/t Au and 27 g/t Ag being extracted by 1937. These workings were centred on an iron stained sheared and fractured quartzite and chert - now known to be part of the extremely silicified and brecciated limestone of the Gold Quarry discovery jasperoid (Ryneer, 1991; Ekburg, et al., 1990). Massive barite veins were also mined from the Schroeder Mountain adits, 2 km to the north of the current Gold Quarry open pit in the mid 1930's with a production of 9000 t.
Note: Jasperoid is a term applied to rock replaced by less than 20% pervasive silica (Madrid & Roberts, 1991)
The Good Hope #7 mine, which is just to the north-west of the Maggie Creek/Gold Quarry Claims and 100m from the Gold Quarry discovery outcrop, was worked for barite in 1937. A large milky white barite vein strikes north-west and dips north-east along the Good Hope Fault system. The vein was 50 to 75m long and 2m thick. It cut highly silicified and brecciated Roberts Mountains Formation limestone which formed a large jasperoid body near the junction of the Good Hope and Gold Quarry faults (Ekburg, et al., 1990).
Drilling of the Blue Star turquoise mine in 1960 obtained values of 14 g/t Au over 3 m, while 1.5 m channel samples in the deeper parts of the old workings returned values of up to 20 g/t Au. Attempts were made to develop the property in 1960-61, although only four 6.2 kg bars were produced due to metallurgical problems. In 1961, as detailed below, Newmont evaluated the mine and estimated that it contained at least 0.5 Mt @ 4.5 to 6 g/t Au. They were not however able to conclude an arrangement over the claims with the owners (Coope, 1991).
Newmont initiated an exploration program in the Big Six, Maggie Creek and Blue Star areas in 1961. The third drill hole intersected significant mineralisation over a 24 m interval. A program of 800 drill holes on a 30 m grid delineated a reserve of 11 Mt @ 10.97 g/t Au establishing the Carlin deposit (Ryneer, 1991). Mining commenced at Carlin in 1965.
In 1962 Newmont also acquired leases over the Maggie Creek /Gold Quarry Claims and between 1962 and 1970 drilled out a resource of 0.306 Mt @ 4.1 g/t Au. Due to discouraging metallurgical tests and the low grade at the prevailing gold price the leases were sold. They were re-acquired in 1972 and further testing commenced. This was the result of a re-appraisal of the prospect suggesting it was open-ended. Between 1972 and 1977 drilling of anomalous areas south-west of the Maggie Creek/Gold Quarry Claims delineated a resource of 4.35 Mt @ 3.2 g/t Au on which mining as the Maggie Creek Mine commenced in 1980. Exploration drilling 600m south of the original Maggie Creek/Gold Quarry Claims and 300 m east of Maggie Creek Mine intersected further significant Au and after a program of 550 holes some 130 Mt @ 1.68 g/t Au was delineated, establishing the main Gold Quarry deposit (Ryneer, 1991).
In 1979 leases over the Rain claims, some 27 km to the south-east were acquired by Newmont. These claims were originally taken out to cover a barite occurrence. Testing delineated a resource of 12.8 Mt @ 2.6 g/t Au soon after (Ryneer, 1991).
The Dee deposit was discovered by Cordex Exploration in 1980. It consists of two orebodies, the Main and Ridge. Initial drilling in the two deposits outlined 2.7 Mt @ 3.63 g/t Au, and an additional low grade resource of 3 Mt @ 0.8 g/t Au (McFarlane, 1991).
The Post deposit was located by Newmont after a program of testing starting in 1983. In 1984 work commenced at Blue Star, with the eighth hole intersecting 18 m @ 3.5 g/t Au. By 1986 drilling had delineated 12.2 Mt @ 3.2 g/t Au at Blue Star and by 1986 mining had commenced at the resulting Genesis Mine (Ryneer, 1991).
In 1986, the Upper Post and then the Lower Post orebodies were discovered within the American Barrick leases, and subsequently the Goldstrike/Betze orebody (Ryneer, 1991).
From 1980 to 1987 exploration was carried out in the Ivanhoe district resulting in the delineation of the Hollister deposit. This work was initially carried out by US Steel, who after outlining 10 Mt @ 1.5 g/t Au, sold their interest to Cornucopia Resources. Galactic Resources Ltd later entered into a joint venture. The resources have since been extended (Bartlett, et al., 1990). Newmont is now testing the property and have intersected high grade intervals of 5.6 m @ 52 g/t Au at a depth of 227 m and 0.73 m @ 1281 g/t from a similar depth. Both intersections are below the low grade resource (Mining Journal, p198, Sept. 16, 1994).
Between 1985 and 1987 the Bobcat, Gnome, Lantern, Capstone (at Bootstrap) and the Deep West Extension at Gold Quarry were all delineated, adding an extra 110t of Au to Newmonts reserves. Following the discovery of the Deep West Extensions, further deep targets were tested, resulting in the Deep Post intersection of 143m @ 32.1 g/t Au at a depth of 600m (Ryneer, 1991).
Continued exploration by Newmont during 1987 focused on areas to the north-west of Gold Quarry, resulting in the discovery of Tusc and MAC based on geochemical and geological targets. Continued deep drilling at Post and Gold Quarry extended reserves during 1988 and 1989. The Deep Star deposit was located in 1989 after an intersection of 107m @ 26.6 g/t Au in the first hole (Ryneer, 1991). Exploration (1993) has delineated Mike to the north-west of the Gold Quarry, MAC and Tusc deposits.
For detail consult the reference(s) listed below.
The most recent source geological information used to prepare this decription was dated: 2002.
This description is a summary from published sources, the chief of which are listed below.
© Copyright Porter GeoConsultancy Pty Ltd. Unauthorised copying, reproduction, storage or dissemination prohibited.
|
|
|
Selected References:
|
Bawden T M, Einaudi M T, Bostick B C, Meibom A, Wooden J, Norby J W, Orobona M J T, Chamberlain C P 2003 - Extreme 34S depletion in ZnS at the Mike gold deposit, Carlin Trend, Nevada: Evidence for bacteriogenic supergene sphalerite: in Geology v31 pp 913-916
|
Cline, J.S., Hofstra, A.H., Muntean, J.L., Tosdal, R.M. and Hickey, K.A., 2005 - Carlin-Type Gold Deposits in Nevada: Critical Geologic Characteristics and Viable Models: in Hedenquist, J.W., Thompson, J.F.H., Goldfarb, R.J. and Richards, J.P. (eds.), Economic Geology, 100th Anniversary Volume, Society of Economic Geologists, pp. 451-484.
|
Emsbo P, Groves D I, Hofstra A H and Bierlein F P, 2006 - The giant Carlin gold province: a protracted interplay of orogenic, basinal, and hydrothermal processes above a lithospheric boundary : in Mineralium Deposita v41 pp 517-525
|
Hollingsworth, E.R., Ressel, M.W. and Henry, C.D., 2017 - Age and Depth of Carlin-type Gold Deposits in the Southern Carlin Trend: Eocene Mountain Lakes, Big Volcanoes, and Widespread, Shallow Hydrothermal Circulation: in Bedell, R.L., and Ressel, M.W., (eds.), 2017 Shallow Expressions of Carlin-type Systems, Alligator Ridge and Emigrant Mines, Nevada Geological Society of Nevada field trip guidebook, October 13-15, 2017, SP-64, pp. 149-173.
|
Leach T M 2004 - Distribution of alteration and mineralisation in the northern Carlin Trend gold deposits, Nevada: in Hi Tech and World Competitive Mineral Success Stories Around the Pacific Rim,� Proc. Pacrim 2004 Conference, Adelaide, 19-22 September, 2004, AusIMM, Melbourne,� pp 153-159
|
Ramadorai G, Hausen D M and Bucknam C H, 1991 - Metallurgical, analytical and mineralogical features of Carlin refractory ores: in Ore Geology Reviews v6 pp 119-132
|
Ressel M W and Henry�C D, 2006 - Igneous Geology of the Carlin Trend, Nevada: Development of the Eocene Plutonic Complex and Significance for Carlin-Type Gold Deposits: in Econ. Geol. v101 pp 347-383
|
Theodore T G, Kotlyar B B, Singer D A, Berger V I, Abbott E W, Foster A L 2003 - Applied geochemistry, geology and mineralogy of the northernmost Carlin Trend, Nevada: in Econ. Geol. v98 pp 287-316
|
|
Porter GeoConsultancy Pty Ltd (PorterGeo) provides access to this database at no charge. It is largely based on scientific papers and reports in the public domain, and was current when the sources consulted were published. While PorterGeo endeavour to ensure the information was accurate at the time of compilation and subsequent updating, PorterGeo, its employees and servants: i). do not warrant, or make any representation regarding the use, or results of the use of the information contained herein as to its correctness, accuracy, currency, or otherwise; and ii). expressly disclaim all liability or responsibility to any person using the information or conclusions contained herein.
|
Top | Search Again | PGC Home | Terms & Conditions
|
|